The Three Horsemen of LTV and the UA Multiplier
Games are one of the few categories where the LTV model is unusually literal. Teams can observe user acquisition spend, platform fees, monetization, and the timing of payback directly. That makes gaming a good place to sharpen the model rather than talk about it in abstractions. The useful object here is the UA multiplier.
For every $1 spent on user acquisition, how many dollars of gross revenue does a game need to generate to break even?
The recent Twitter brouhaha over paid acquisition has not been kind to venture capitalists, but it also reveals a misunderstanding of the LTV model. Bill Gurley's excellent piece, "The Dangerous Seduction of the Lifetime Value (LTV) Formula", is really an attack on sloppy usage of the model, not on the model itself.
All businesses run on LTV > UA; the question is how literal and useful it is. Gaming is one of the cleanest cases because firms literally calculate it.
The Three Horsemen
The three horsemen of game LTV are platform take, payback window, and the discount rate. The first cuts your revenue immediately, while the second and third cut it over time.
1. Platform Take
Let the app-platform take rate be 30% and the web-platform take rate be 5%. Developers therefore keep 70% of app revenue and 95% of web revenue.
\[\begin{aligned}\text{Platform revenue share rate}&= (1-\text{App platform take rate}) \times (1-\text{Web revenue share}) \\&\quad + (1-\text{Web platform take rate}) \times \text{Web revenue share}\end{aligned}\]
If we plug in a 30% app-store take and a 5% web-store take, that collapses to:
\[\text{Platform revenue share rate} = 0.70 + 0.25 \times \text{Web revenue share}\]
The first horseman tells us how much of gross revenue the game actually keeps before we even start talking about time. Even before discounting enters the picture, app-only economics already force a gross-up: if the developer keeps only $0.70 of every gross $1, it needs about $1.43 of gross revenue just to recover $1 of UA spend.
2. Payback Window
Even if two games generate the same gross revenue, the faster one is worth more. Revenue collected quickly can be reinvested quickly.
To keep the first pass literal, assume revenue arrives evenly over the payback window. That is a simplifying assumption, not a claim for every title:
\[\text{Time discount}(\text{payback days}) = \frac{1}{\text{payback days}}\sum_{day=1}^{\text{payback days}}\frac{1}{(1+\text{Treasury rate})^{day/365}}\]
The longer the payback window gets, the smaller this factor becomes. At a 4.4% Treasury rate, the factor is ~.98 over a 365-day window and ~.96 over a 730-day window. In plain English, a dollar collected evenly over a year is worth ~98c today; over two years, it is worth ~96c.
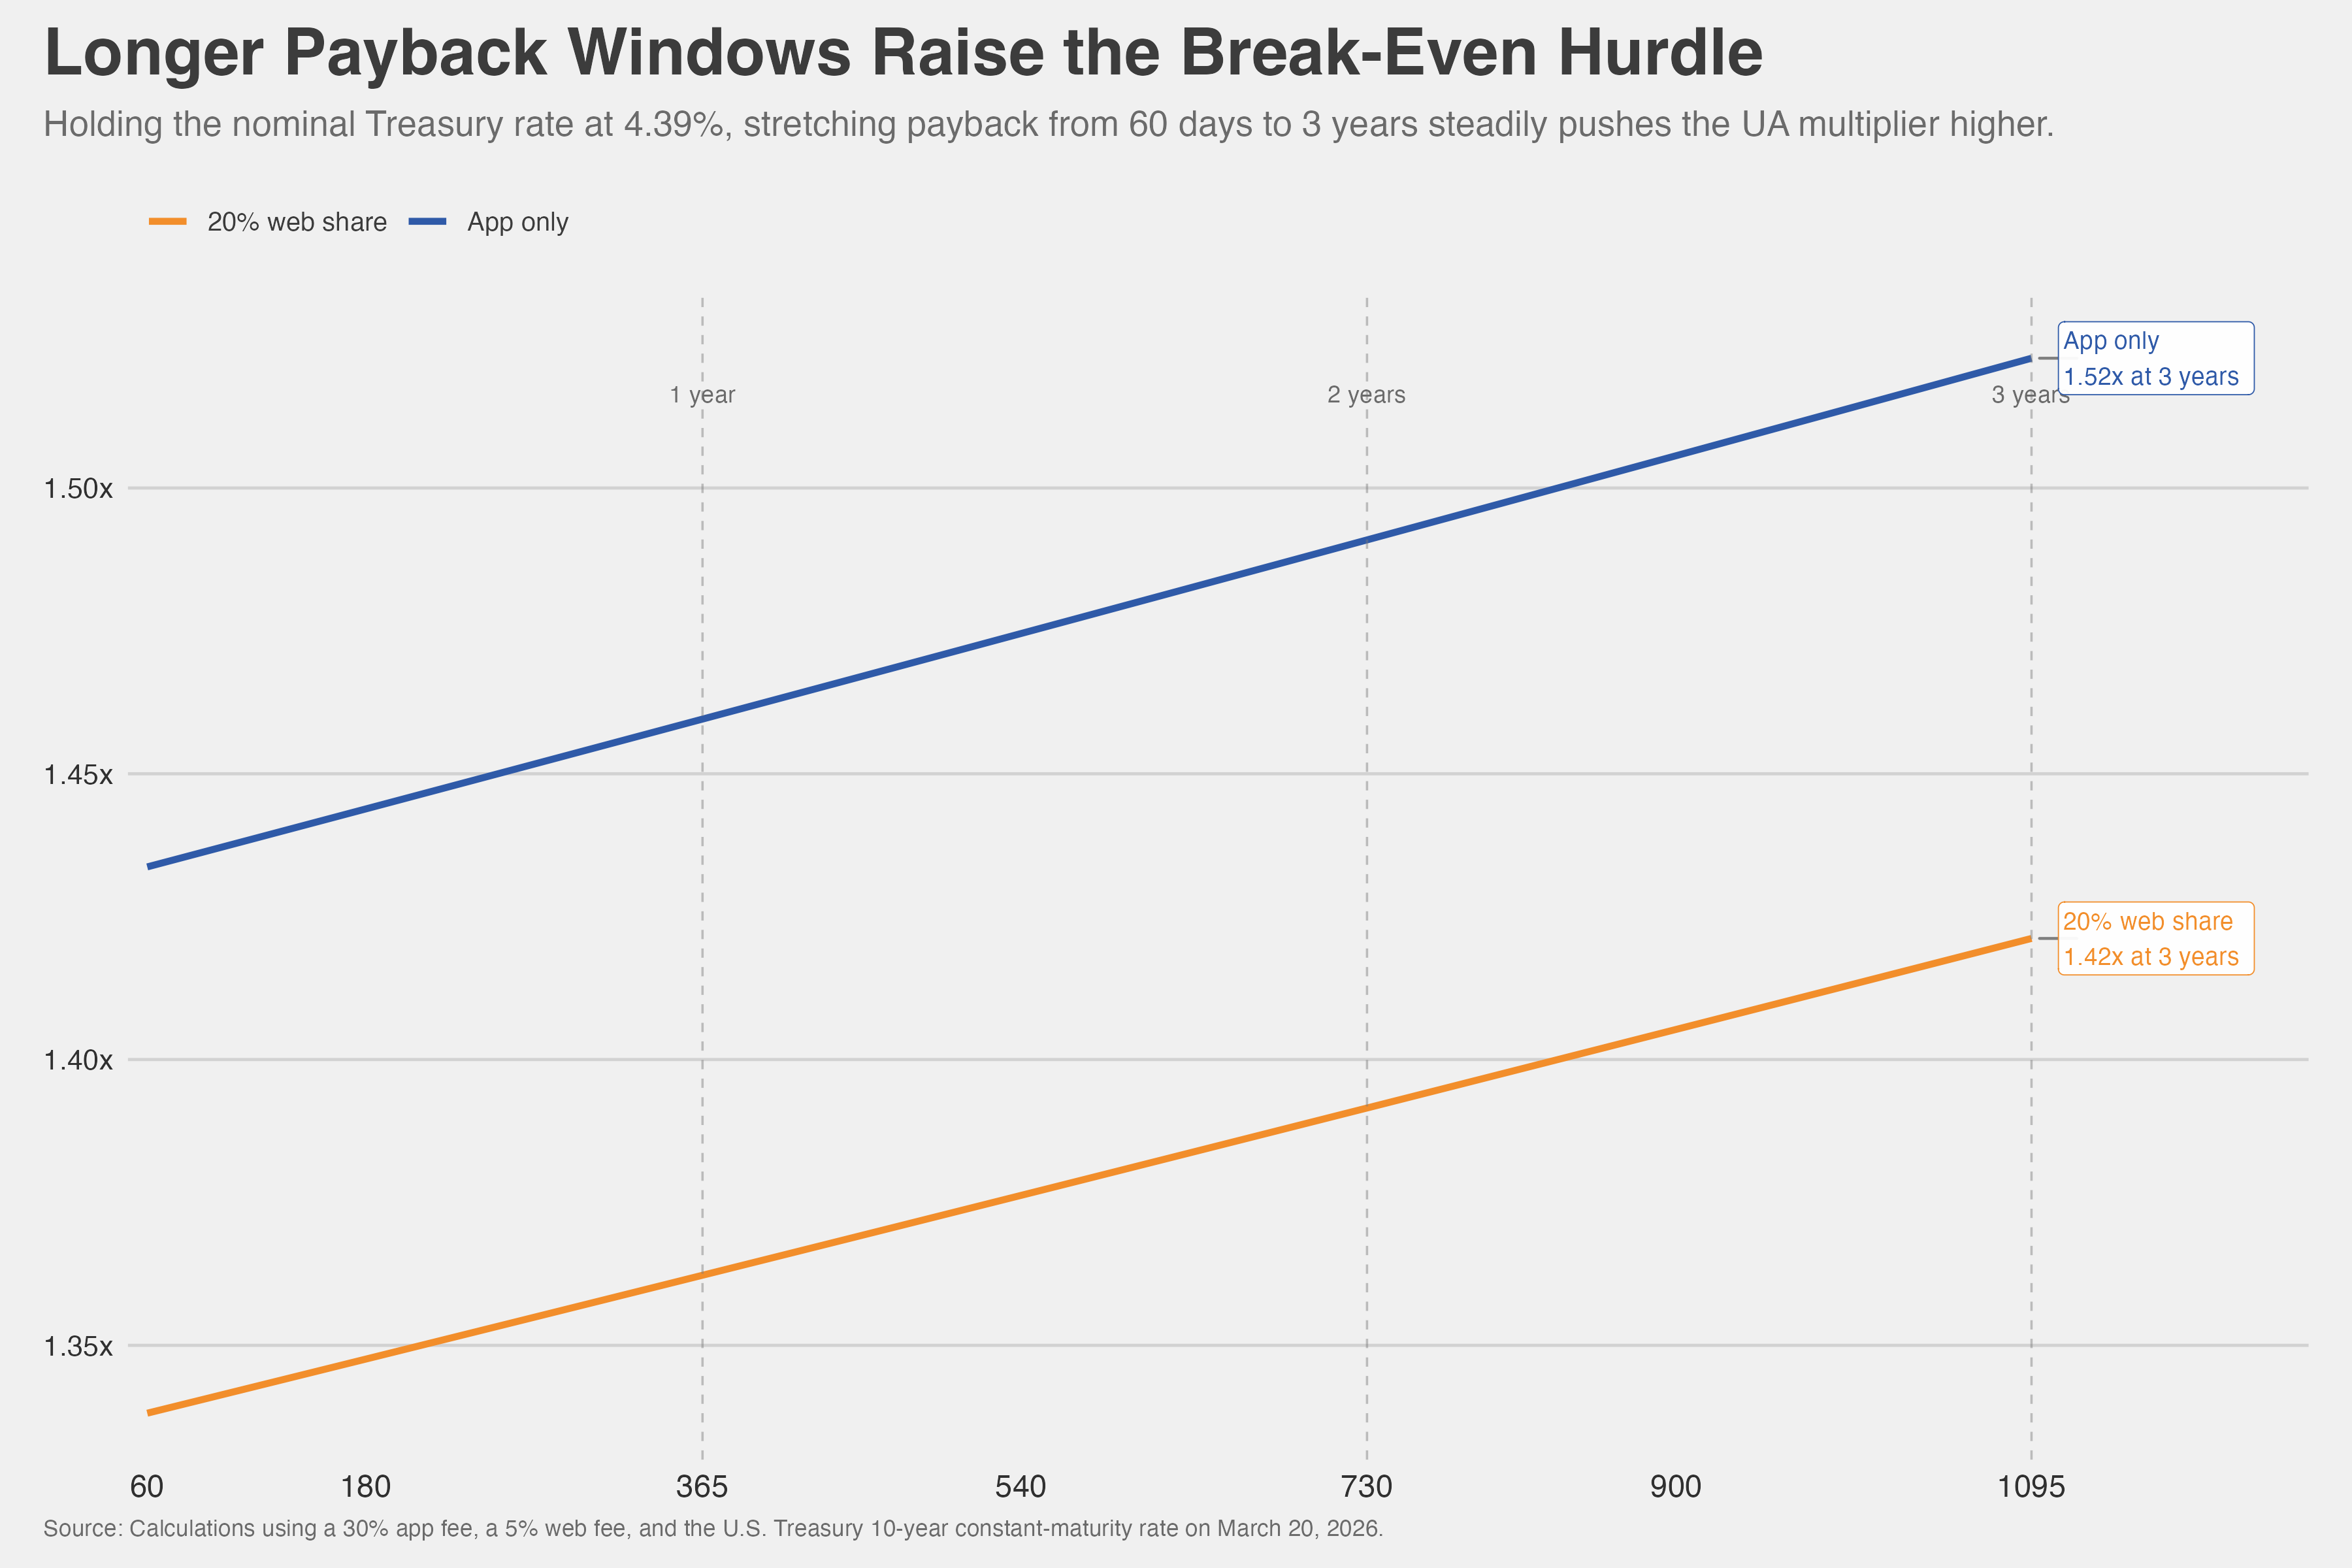
Hold the Treasury rate fixed at 4.39% and vary only the payback window, and the break-even curve looks like this:
3. Treasury Rate
The third horseman is the discount rate itself. A clean public benchmark is the U.S. Treasury market.
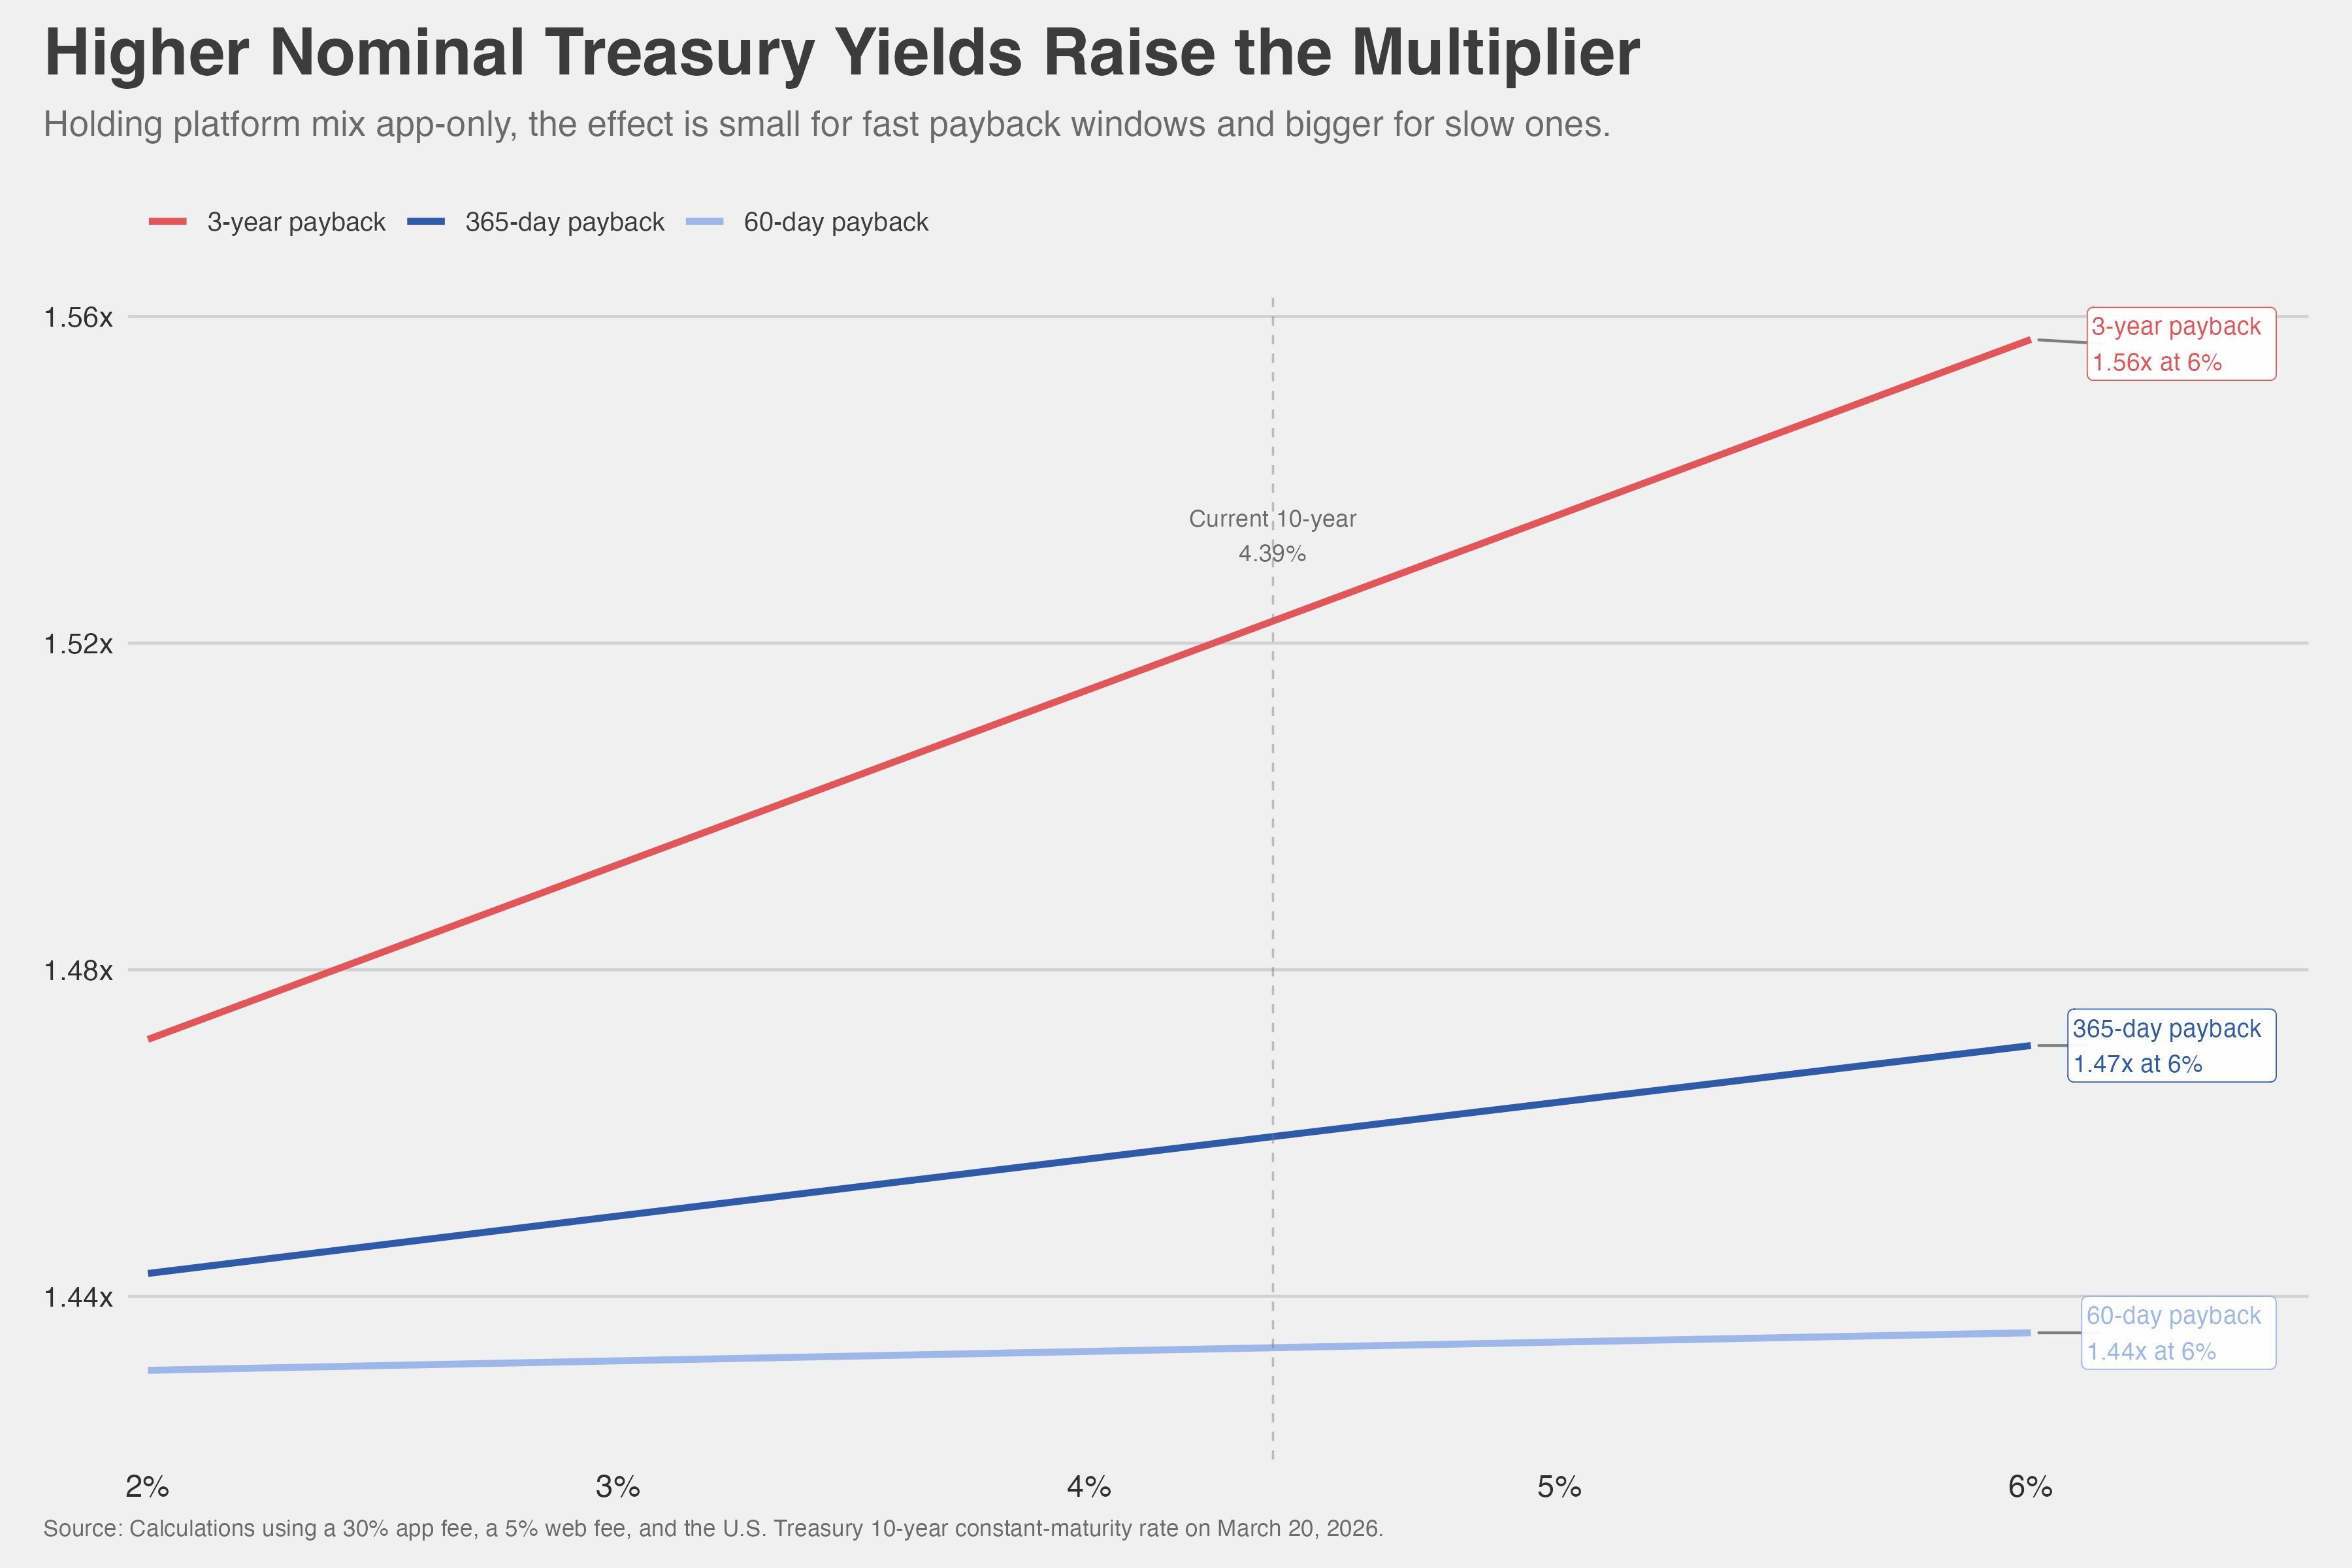
On March 20, 2026, nominal Treasury yields were 3.88% at 1 year, 4.01% at 5 years, 4.39% at 10 years, 4.97% at 20 years, and 4.96% at 30 years. The same date's 10-year real yield was about 2%. The nominal series is available in the official Treasury table, and the real series is in the Treasury real-yield table.
Nominal Treasury yields already embed expected inflation, so we do not need to add inflation separately inside the formula.
Hold platform mix fixed and vary only the nominal Treasury yield, and the sensitivity looks like this:
Putting the Model Together
Together, the three horsemen feed into the UA multiplier, or how much gross revenue a dollar of UA spend needs to generate at a minimum.
\[\text{Revenue kept today rate} = \text{Platform revenue share rate} \times \text{Time discount}\]
\[\text{UA multiplier} = \frac{1}{\text{Revenue kept today rate}}\]
\[\text{Break-even gross revenue} = \text{UA spend} \times \text{UA multiplier}\]
Take the simplest app-only case with a 365-day payback window and $1 of UA spend. The platform revenue share rate is .70. The time discount is ~.98. That means the revenue kept today rate is ~.69. So the cohort does not break even at $1 of gross revenue. It breaks even at about $1.46.
No empirical dark arts needed! The game pays for acquisition up front, gives a platform a cut, and collects revenue over time. The model's job is simply to translate those frictions into the UA multiplier the cohort must clear.
What the UA Multiplier Looks Like Right Now
Using the nominal 10-year Treasury at 4.4%, the scenarios look like this:
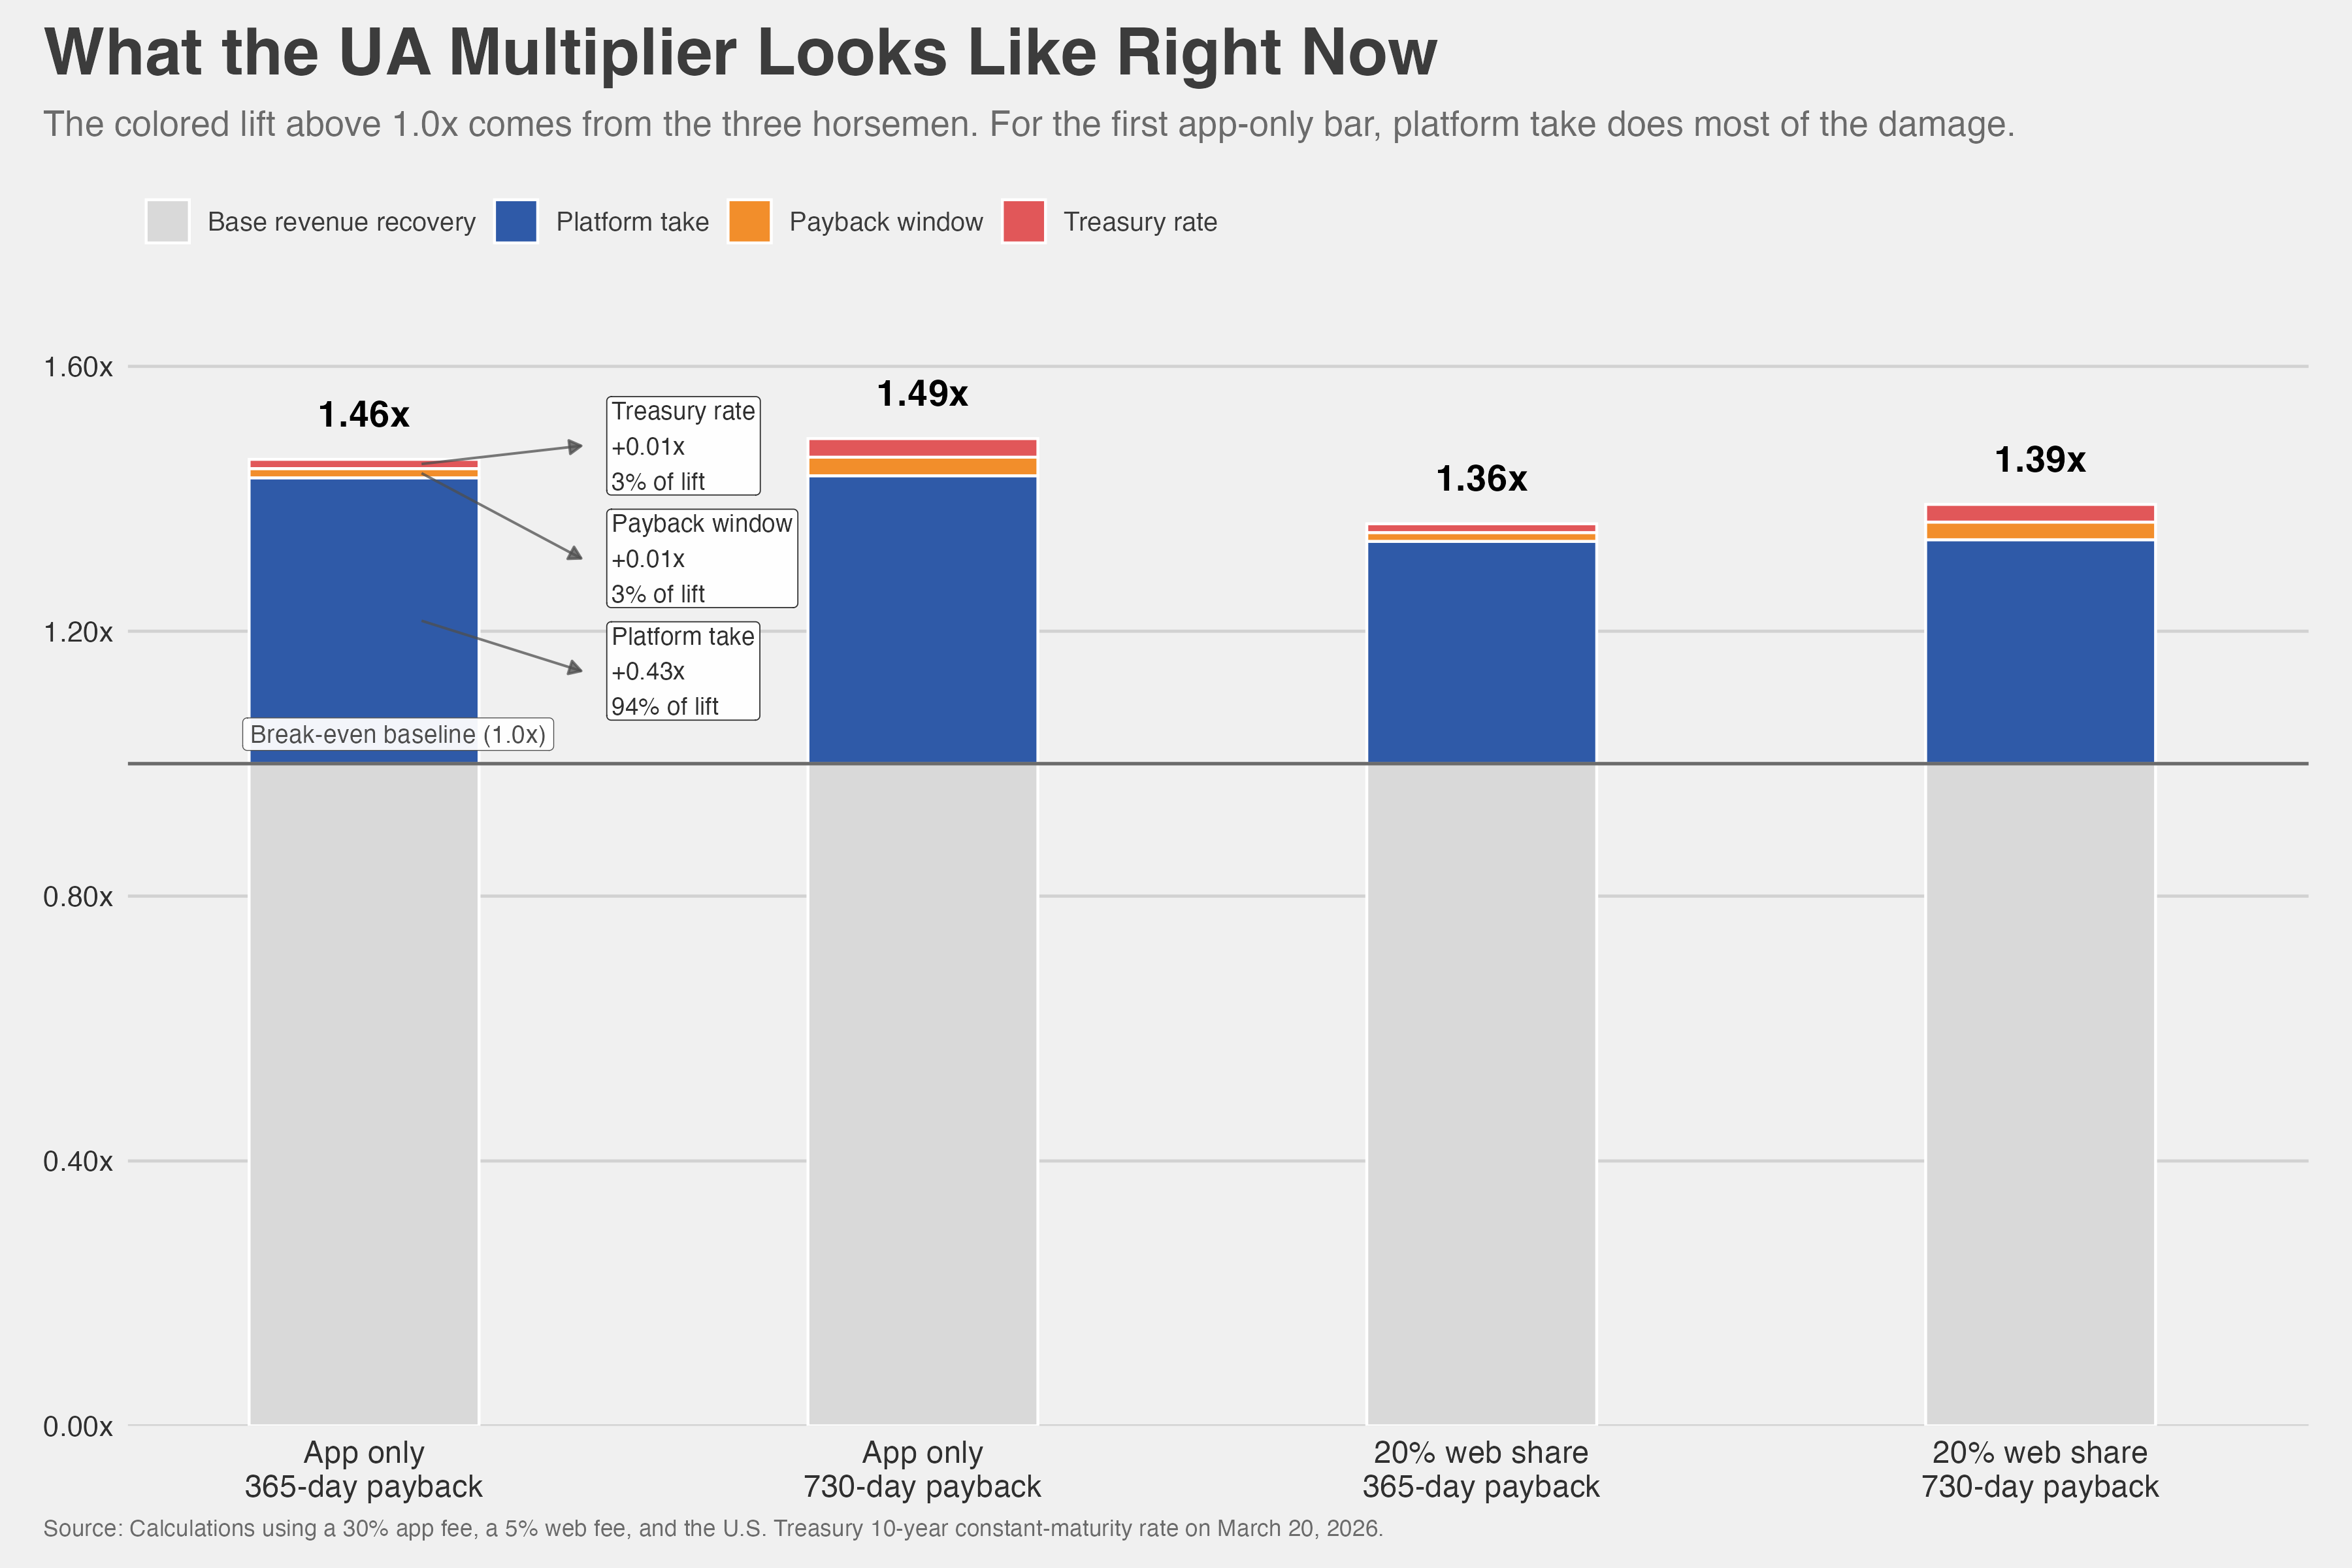
App-only at a one-year payback window lands around 1.46x. Stretch the payback window to two years and it rises to about 1.49x. Move 20% of revenue to the web and the hurdle drops to roughly 1.36x to 1.39x. Whether those platform-fee savings later get competed away into higher UA bids is a separate question.
Platform take is doing most of the taking, so web mix and margin matters. Moving just 20% of revenue to the web lowers the multiplier by roughly ten cents per UA dollar, which is a bigger swing here than extending payback from one year to two.