Gaming Market
Last updated: Mar 20, 2026 10:54 PM
Weekly view of gaming public markets and Polymarket video-game questions. Data refreshes after US market close.
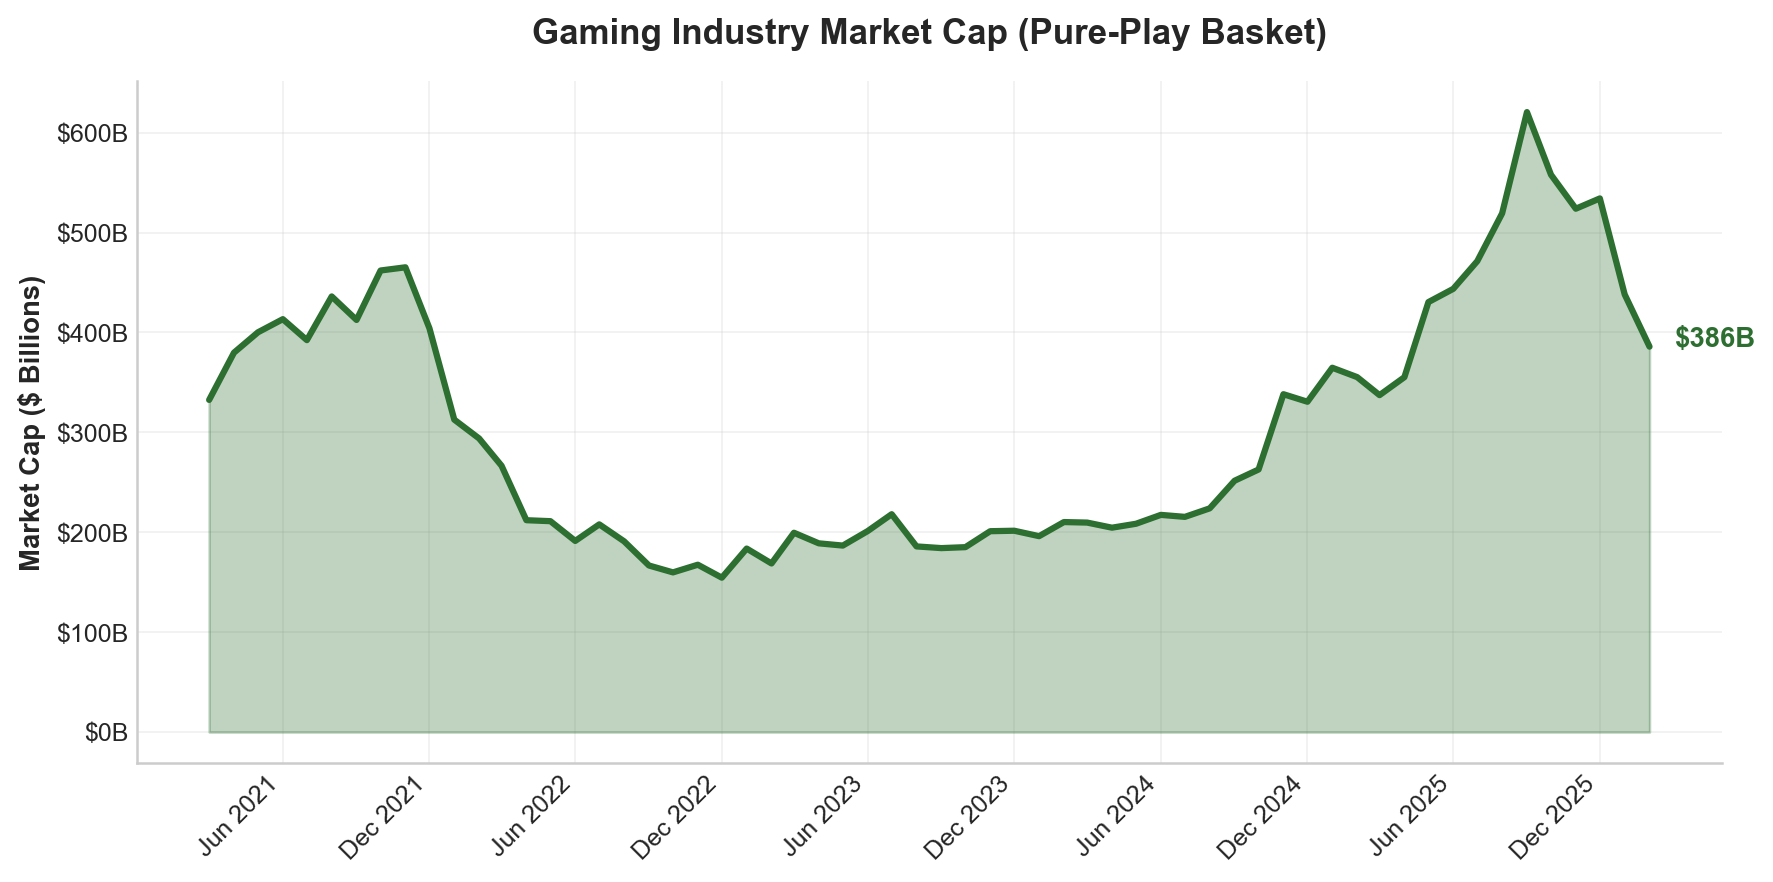
Pure-play basket covered: Electronic Arts (EA), Take-Two Interactive (TTWO), AppLovin (APP), Unity (U), Roblox (RBLX), NetEase (NTES), Sea Limited (Garena) (SE)
Pure-play gaming company basket (not broad conglomerates).
Activision Blizzard is excluded because Microsoft completed its acquisition on October 13, 2023.
Global Gaming Market Cap Leaders
USD-normalized market caps across US, Chinese, Japanese, and Korean companies, with week-over-week market cap change.
Total leaders: $1.10T | 1W: -$53.68B (-4.67%) | 26W: -$308.52B (-21.96%) | 52W: +$65.00B (+6.30%)
| Global Gaming Market Cap Leaders (USD) | ||||||
| Company | Rank | Market Cap | 1W Δ Cap | 1W Δ % | 26W Δ % | 52W Δ % |
|---|---|---|---|---|---|---|
| China | ||||||
| Tencent | 1 | $585.19B | -$58.17B | -9.04% | -20.75% | -0.11% |
| NetEase | 3 | $73.18B | -$2.51B | -3.31% | -23.07% | +18.43% |
| Bilibili | 11 | $9.81B | +$1.41B | +16.84% | +11.48% | +50.65% |
| United States | ||||||
| AppLovin | 2 | $149.51B | +$10.31B | +7.41% | -24.34% | +43.32% |
| Electronic Arts | 5 | $50.18B | +$75.07M | +0.15% | +15.84% | +39.31% |
| Roblox | 6 | $40.37B | +$1.22B | +3.11% | -55.41% | -0.27% |
| Take-Two Interactive | 7 | $37.15B | -$1.31B | -3.40% | -20.27% | -6.03% |
| Japan | ||||||
| Nintendo | 4 | $70.48B | -$2.65B | -3.62% | -23.08% | -7.94% |
| Konami | 8 | $17.21B | -$591.71M | -3.32% | -4.43% | +14.80% |
| Bandai Namco | 9 | $16.98B | -$349.66M | -2.02% | -12.72% | -18.19% |
| Nexon | 10 | $14.27B | -$752.22M | -5.01% | -13.81% | +41.94% |
| Capcom | 12 | $9.29B | -$65.68M | -0.70% | -12.42% | -3.51% |
| Square Enix | 14 | $5.76B | -$215.13M | -3.60% | -21.01% | +13.24% |
| Sega Sammy | 15 | $3.32B | -$111.35M | -3.24% | -16.61% | -13.00% |
| Korea | ||||||
| Krafton | 13 | $6.99B | +$29.66M | +0.43% | -23.14% | -29.21% |
| NCSoft | 16 | $2.94B | +$25.77M | +0.88% | -3.18% | +41.88% |
| Netmarble | 17 | $2.85B | -$49.00M | -1.69% | -20.13% | +32.61% |
| Shift Up | 18 | $1.17B | +$13.49M | +1.17% | -25.70% | -46.19% |
Polymarket Video-Game Questions
Active video-game markets with current probability, one-week price change, and liquidity/volume metrics.
No active Polymarket video-game markets available.